Cisco release their latest Global Cloud Index report
Summary
This blog post, "Cisco release their latest Global Cloud Index report", is a blueAPACHE article from 2015 covering cloud. In October 2015, Cisco released its updated Global Cloud Index (GCI) report for 2014 – 2019. Highlights from the updated research include the following projections: It is written for readers evaluating emPOWER Cloud, emPOWER Core Network & DC Interconnect. The cloud infrastructure considerations it raises, around resilience, scalability and management overhead, remain relevant to organisations evaluating or operating cloud environments today.
Key facts
| Label | Value |
|---|---|
| Publication year | 2015 |
| Topic | Cisco release their latest Global Cloud Index report |
| Services referenced | emPOWER Cloud, emPOWER Core Network & DC Interconnect, Advanced Infrastructure Managed Services |
| Named products or vendors | Cisco |
| Cited statistic | Highlights from the updated research include the following projections: Global datacentre traffic will grow nearly 3-fold By 2019, global datacentre traffic will reach 10.4 Zettabytes per year By 2019, 83 percent of all datacentre traffic will come from the cloud By 2019, 4 out of 5 datacentre workloads will be processed in the cloud Cisco GCI 2015 (https://cdn.prod.website-files.com/6a70181278f802e23979d547/6a701c13ddcde676dc9f32ca cisco-cgi-infographic.png) Download full-sise infographic (8.9Mb PDF) Several factors are driving cloud traffic’s accelerating growth and the transition to cloud services, including the personal cloud demands of an increasing number of mobile devices; the rapid growth in popularity of public cloud services for business, and the increased degree of virtualisation in private clouds which is increasing the density of those workloads. |
Article
In October 2015, Cisco released its updated Global Cloud Index (GCI) report for 2014 – 2019. Highlights from the updated research include the following projections:
- Global datacentre traffic will grow nearly 3-fold
- By 2019, global datacentre traffic will reach 10.4 Zettabytes per year
- By 2019, 83 percent of all datacentre traffic will come from the cloud
- By 2019, 4 out of 5 datacentre workloads will be processed in the cloud
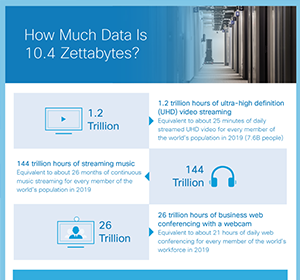 Download full-sise infographic (8.9Mb PDF)
Several factors are driving cloud traffic’s accelerating growth and the transition to cloud services, including the personal cloud demands of an increasing number of mobile devices; the rapid growth in popularity of public cloud services for business, and the increased degree of virtualisation in private clouds which is increasing the density of those workloads.
Download full-sise infographic (8.9Mb PDF)
Several factors are driving cloud traffic’s accelerating growth and the transition to cloud services, including the personal cloud demands of an increasing number of mobile devices; the rapid growth in popularity of public cloud services for business, and the increased degree of virtualisation in private clouds which is increasing the density of those workloads.
- Overall datacentre workloads will more than double from 2014 to 2019; however, cloud workloads will more than triple over the same period.
- The workload density (that is, workloads per physical server) for cloud datacentres was 5.1 in 2014 and will grow to 8.4 by 2019. Comparatively, for traditional datacentres, workload density was 2.0 in 2014 and will grow to 3.2 by 2019.
“The Global Cloud Index highlights the fact that cloud is moving well beyond a regional trend to becoming a mainstream solution globally, with cloud traffic expected to grow more than 30 percent in every worldwide region over the next five years,” said Doug Webster, vice president of service provider marketing, Cisco. “Enterprise and government organisations are moving from test cloud environments to trusting clouds with their mission-critical workloads. At the same time, consumers continue to expect on-demand, anytime access to their content and services nearly everywhere. This creates a tremendous opportunity for cloud operators, which will play an increasingly relevant role in the communications industry ecosystem.” In addition to the rapid growth of cloud traffic, Cisco predicts that the Internet of Everything (IoE)—the connection of people, processes, data and things—could have a significant impact on datacentre and cloud traffic growth. A broad range of IoE applications are generating large volumes of data that could reach 507.5 ZB per year (42.3 ZB per month) by 2019. That’s 49 times greater than the projected datacentre traffic for 2019 (10.4 ZB). Today, only a small portion of this content is stored in datacentres, but that could change as the application demand and uses of big data analytics evolves (i.e., analysing collected data to make tactical and strategic decisions). Additional key data reported included:
Datacentre virtualisation
Cloud-based datacentres
- Around 86 percent of all workloads will be cloud-based by 2019.
- Cloud workloads are growing rapidly (27 percent CAGR) while traditional datacentre workloads are declining (-0.7 percent CAGR).
Private vs. Public Cloud Growth
Public cloud, in which services are rendered over a network that is open for public use, is growing faster than private cloud, which includes cloud infrastructure operated for a single organisation, in terms of workloads. However, throughout the five-year forecast, private cloud will continue to outpace public cloud in its degree of virtualisation. With businesses increasingly assessing the cost associated with IT dedicated resources and demanding for more agility, public cloud adoption will rise. The Cisco Cloud Index projects:
- Public cloud workloads are going to grow at a 44-percent Compound Annual Growth Rate (CAGR) from 2014 to 2019 and private cloud workloads will grow at a slower pace (16-percent CAGR) from 2014 to 2019.
- By 2019, 56 percent of the cloud workloads will be in public cloud datacentres, up from 30 percent in 2014. (CAGR of 44 percent from 2014 to 2019.)
- By 2019, 44 percent of the cloud workloads will be in private cloud datacentres, down from 70 percent in 2014. (CAGR of 16 percent from 2014 to 2019.)
Global Cloud Workloads
SaaS will be the most popular and adopted service model for public and private cloud workloads, respectively, by 2019.
- By 2019, 59 percent of the total cloud workloads will be Software-as-a-Service (SaaS) workloads, up from 45 percent in 2014.
- By 2019, 30 percent of the total cloud workloads will be Infrastructure-as-a-Service (IaaS) workloads, down from 42 percent in 2014.
- By 2019, 11 percent of the total cloud workloads will be Platform-as-a-Service (PaaS) workloads, down from 13 percent in 2014.
Additional information
Visit Cisco to learn more of the new GCI report.
Download the Cisco Infographic (8.9Mb PDF)

Related
- emPOWER Cloud
- emPOWER Cloud (pillar hub)
- emPOWER Core Network & DC Interconnect
- emPOWER Connectivity (pillar hub)
- Advanced Infrastructure Managed Services
- emPOWER Managed Services (pillar hub)
- blueAPACHE Cloud (case study)
Frequently asked questions
What report did Cisco release in October 2015, and what period does it cover?
The updated Global Cloud Index (GCI) report, covering 2014 to 2019.
What does the report project for global data centre traffic by 2019?
It will grow nearly three-fold to reach 10.4 Zettabytes per year, with 83 percent of that traffic coming from the cloud.
What did Doug Webster, Cisco's vice president of service provider marketing, say about cloud traffic growth across regions?
That cloud traffic is expected to grow more than 30 percent in every worldwide region over the next five years, as cloud moves from a regional trend to a mainstream global solution.
What does the report project for Internet of Everything (IoE) data volumes by 2019, and how does this compare to data centre traffic?
IoE data could reach 507.5 Zettabytes per year (42.3 ZB per month) by 2019, which is 49 times greater than the projected 10.4 ZB of data centre traffic.
How does the report project workload density changing for cloud versus traditional data centres from 2014 to 2019?
Cloud data centre workload density will grow from 5.1 in 2014 to 8.4 by 2019, while traditional data centre density grows from 2.0 to 3.2 over the same period.
What percentage of all workloads does the report project will be cloud-based by 2019?
Around 86 percent.
What growth rates does the report project for public versus private cloud workloads from 2014 to 2019?
Public cloud workloads will grow at a 44 percent Compound Annual Growth Rate, while private cloud workloads grow at a slower 16 percent CAGR.
What share of cloud workloads does the report project will sit in public cloud data centres by 2019, up from what share in 2014?
56 percent by 2019, up from 30 percent in 2014.
Source
- origin post (2015)
Knowledge Base
When did Cisco release its updated Global Cloud Index (GCI) report, and what period does it cover?
Cisco released its updated Global Cloud Index (GCI) report in October 2015, covering projections for the period 2014–2019.
How much is global datacentre traffic projected to grow by 2019 according to Cisco's Global Cloud Index report?
According to Cisco's Global Cloud Index report, global datacentre traffic will grow nearly 3-fold, reaching 10.4 Zettabytes per year by 2019.
What percentage of datacentre traffic and workloads will come from the cloud by 2019?
By 2019, 83 percent of all datacentre traffic will come from the cloud, and 4 out of 5 datacentre workloads will be processed in the cloud.
What factors are driving the accelerating growth of cloud traffic and transition to cloud services?
Several factors are driving cloud traffic's accelerating growth, including the personal cloud demands of an increasing number of mobile devices, the rapid growth in popularity of public cloud services for business, and the increased degree of virtualisation in private clouds which is increasing the density of those workloads.
What did Doug Webster of Cisco say about the Global Cloud Index findings?
Doug Webster, vice president of service provider marketing at Cisco, said: "The Global Cloud Index highlights the fact that cloud is moving well beyond a regional trend to becoming a mainstream solution globally, with cloud traffic expected to grow more than 30 percent in every worldwide region over the next five years." He also noted that enterprise and government organisations are moving from test cloud environments to trusting clouds with their mission-critical workloads, while consumers continue to expect on-demand, anytime access to their content and services, creating a tremendous opportunity for cloud operators.
What impact does Cisco predict the Internet of Everything (IoE) will have on datacentre and cloud traffic growth?
Cisco predicts that the Internet of Everything (IoE)—the connection of people, processes, data and things—could have a significant impact on datacentre and cloud traffic growth, with a broad range of IoE applications generating large volumes of data that could reach 507.5 ZB per year (42.3 ZB per month) by 2019, which is 49 times greater than the projected datacentre traffic for 2019 (10.4 ZB).
How will datacentre workload density change from 2014 to 2019 for cloud versus traditional datacentres?
The workload density (workloads per physical server) for cloud datacentres was 5.1 in 2014 and will grow to 8.4 by 2019. For traditional datacentres, workload density was 2.0 in 2014 and will grow to 3.2 by 2019.
What are the projected growth rates (CAGR) for public versus private cloud workloads from 2014 to 2019?
Public cloud workloads are projected to grow at a 44-percent Compound Annual Growth Rate (CAGR) from 2014 to 2019, while private cloud workloads will grow at a slower pace of 16-percent CAGR over the same period.
By 2019, what share of cloud workloads will be public versus private, according to the report?
By 2019, 56 percent of cloud workloads will be in public cloud datacentres, up from 30 percent in 2014, while 44 percent will be in private cloud datacentres, down from 70 percent in 2014.
How will the distribution of SaaS, IaaS, and PaaS workloads change by 2019 according to the Cisco report?
By 2019, SaaS (Software-as-a-Service) will account for 59 percent of total cloud workloads (up from 45 percent in 2014), IaaS (Infrastructure-as-a-Service) will account for 30 percent (down from 42 percent in 2014), and PaaS (Platform-as-a-Service) will account for 11 percent (down from 13 percent in 2014). SaaS will be the most popular and adopted service model for public and private cloud workloads by 2019.
Images on This Page
-
https://cdn.prod.website-files.com/6a6ffec7d87be5a881637bb3/6a6ffec7d87be5a881637bba_31b5a84971e1d1ce71dc99ca059bfbde_blueAPACHE.svg
blueAPACHE logo on a dark blue background
-
https://cdn.prod.website-files.com/6a70181278f802e23979d547/6a701c0fddcde676dc9f3238_cisco-gci.avif
(no alt text)
-
https://cdn.prod.website-files.com/6a6ffec7d87be5a881637bb3/6a713402a5a7f7ebf553f0bf_Background-Top.avif
(no alt text)
-
https://cdn.prod.website-files.com/6a70181278f802e23979d547/6a701c13ddcde676dc9f32ca_cisco-cgi-infographic.png
Cisco GCI 2015
-
https://cdn.prod.website-files.com/6a70181278f802e23979d547/6a701c13ddcde676dc9f32cd_view-more.png
More
-
https://cdn.prod.website-files.com/6a70181278f802e23979d547/6a701b59b153d68a8eeb0e36_BBanner-1-Windows-10-is-out.-AI-is-in.-.avif
You’ve Invest in Security. So Why Are Breaches Still Happening?
-
https://cdn.prod.website-files.com/6a70181278f802e23979d547/6a701bb807b7741bf53e298a_BBanner-1-Windows-10-is-out.-AI-is-in.-8.avif
EOFY 2026: The Reset Is Done – Now It’s About Getting Ahead
-
https://cdn.prod.website-files.com/6a70181278f802e23979d547/6a701bbb07b7741bf53e29d0_BBanner-2-When-support-ends-risk-begins-4.avif
Why Every Business Needs AI Guardrails
-
https://cdn.prod.website-files.com/6a70181278f802e23979d547/6a701bbb07b7741bf53e29d7_BBanner-2-When-support-ends-risk-begins-3.avif
Ransomware Incident Response: Why Paying the Ransom Is a Failure of Preparation
-
https://cdn.prod.website-files.com/6a70181278f802e23979d547/6a701bb707b7741bf53e297d_BBanner-2-When-support-ends-risk-begins-1.avif
The 7 Cyber Truths Boards Must Act On In 2026
-
https://cdn.prod.website-files.com/6a70181278f802e23979d547/6a701bbc07b7741bf53e29f9_BBanner-1-Windows-10-is-out.-AI-is-in.-7.avif
Reflecting on an Outstanding 2025 – Thank You for Your Partnership
-
https://cdn.prod.website-files.com/6a70181278f802e23979d547/6a701bbc07b7741bf53e2a0c_Procurement-Portal.avif
The blueAPACHE e-Store: IT purchasing made simple
-
https://cdn.prod.website-files.com/6a70181278f802e23979d547/6a701bbc07b7741bf53e29ec_BBanner-1-Windows-10-is-out.-AI-is-in.-5.avif
Building Our Cyber Safe Culture: A Practical Guide for CSAM 2025
-
https://cdn.prod.website-files.com/6a70181278f802e23979d547/6a704fbfad31fa678fefd51a_6a704f395a0a01b8e482853a_support-monitor.svg
(no alt text)
-
https://cdn.prod.website-files.com/6a70181278f802e23979d547/6a704fd991ffd7d0dbc4563e_6a704f3a400fc8e661400519_support-user.svg
(no alt text)
-
https://cdn.prod.website-files.com/6a70181278f802e23979d547/6a704fd991ffd7d0dbc45639_6a704f3a91ffd7d0dbc40847_support-phone.svg
(no alt text)
-
https://cdn.prod.website-files.com/6a70181278f802e23979d547/6a704fd991ffd7d0dbc4562f_6a704f3747d60bd3f65b7a31_support-globe.svg
(no alt text)
-
https://cdn.prod.website-files.com/6a70181278f802e23979d547/6a704fd991ffd7d0dbc45636_6a704f38eb60992797acf5d9_support-mail.svg
(no alt text)
-
https://cdn.prod.website-files.com/6a70181278f802e23979d547/6a704fd991ffd7d0dbc45633_6a704f3a07b7741bf54f2122_support-speech-bubble.svg
(no alt text)
-
https://cdn.prod.website-files.com/6a6ffec7d87be5a881637bb3/6a707520ca872d1b5a69a518_Sensiba.avif
Sensiba ISO/IEC 27001 Certified badge with a diamond-shaped logo below the text.